Financial Information
PT LOTTE CHEMICAL TITAN TbkPT LOTTE CHEMICAL TITAN Tbk and its subsidiaries consolidated performance and
financial results are summarized below.
Home
Investor Relations
Financial Information
Summarized Consolidated Statement of Profit or Loss and Other Comprehensive Income
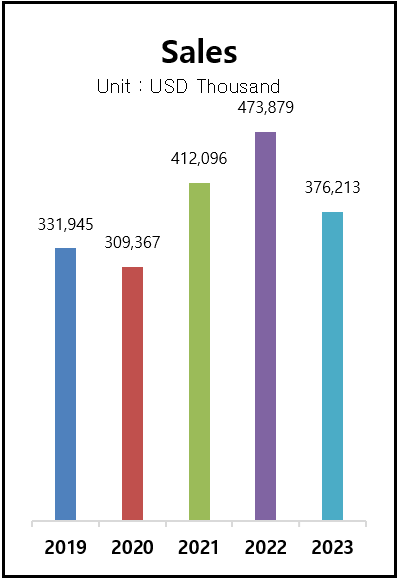
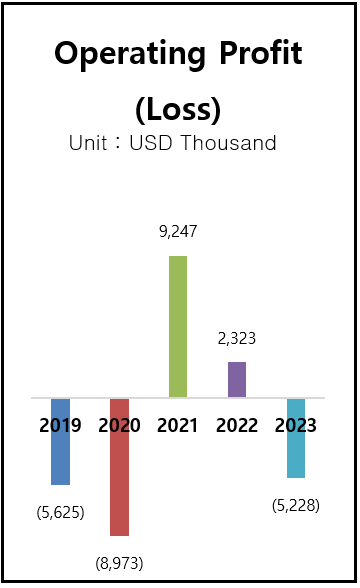
[Unit: USD Thousand]| Description | 2019 | 2020 | 2021 | 2022 | 2023 |
|---|---|---|---|---|---|
| Sales | 331,945 | 309,367 | 412,096 | 473,879 | 376,213 |
| Gross Profit | 4,556 | 1,943 | 23,595 | 14,490 | 6,433 |
| Operating Income (Loss) | (5,625) | (8,973) | 9,247 | 2,323 | -5,228 |
| Net Income (Loss) Before Income Taxes | (4,333) | (7,825) | 12,232 | 3,147 | -1,140 |
| Consolidated Net Income(Loss) | (3,286) | (4,945) | 9,564 | 2,896 | -400 |
| Net Income (Loss) Attributable to Equity Holders of Parent Company and Non-Controlling Interests | (3,286) | (4,945) | 9,564 | 2,896 | -400 |
| Comprehensive Income (Loss) | (3,339) | (4,172) | 9,470 | 2,857 | -500 |
| Comprehensive Income (Loss) Attributable to Equity Holders of Parent Company and Non-Controlling Interests | (3,339) | (4,172) | 9,470 | 2,857 | -500 |
| Net Income (Loss) per Share (full amount) | (0.0006) | (0.0009) | 0.0017 | 0.0005 | 0.0001 |
* Continued Operations
Summarized Consolidated Statement of Financial Position
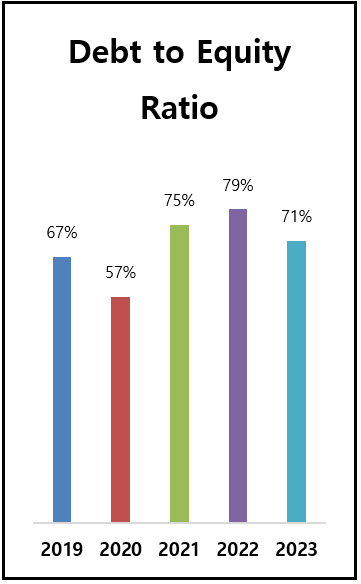
[Unit: USD Thousand]| Description | 2019 | 2020 | 2021 | 2022 | 2023 |
|---|---|---|---|---|---|
| Total Assets | 165,728 | 149,377 | 183,022 | 192,224 | 182,670 |
| Total Liabilities | 66,532 | 54,215 | 78,390 | 84,735 | 75,681 |
| Total Stockholders’ Equity | 99,196 | 95,162 | 104,632 | 107,489 | 106,989 |
| Current Ratio | 132% | 158% | 165% | 151% | 136% |
| Liabilities to Equity Ratio | 67% | 60% | 75% | 79% | 71% |
| Debt to Assets Ratio | 40% | 36% | 43% | 44% | 41% |
| Net Income (Loss) Margin Ratio | (0.99%) | (1.60%) | 2.32% | 0,61% | -0,11% |
| Return on Assets Ratio | (1.98%) | (3.31%) | 5.23% | 1,51% | -0,22% |
| Return on Equity Ratio | (3.31%) | (5.20%) | 9.14% | 2,69% | -0,37% |