LOTTE CHEMICAL TITAN

Financial Information

PT LOTTE CHEMICAL TITAN Tbk

PT LOTTE CHEMICAL TITAN Tbk and its subsidiaries consolidated performance and
financial results are summarized below.

Home Investor Relations Financial Information
  • Sales : 2010 (404,342) / 2011 (537,237) / 2012 (570,089) / 2013 (586,375) / 2014 (621,731)
  • Oprerating Loss : 2010 (10,610) / 2011 (7,917) / 2012 (5,698) / 2013 (2,373) / 2014 (3,702)
  • Debt Ratio : 2010 (130%) / 2011 (172%) / 2012 (202%) / 2013 (192%) / 2014 (176%)

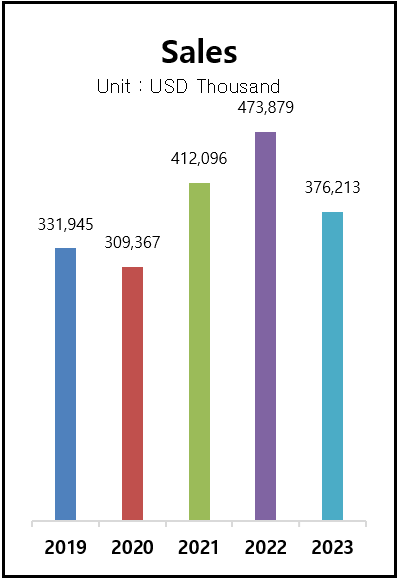
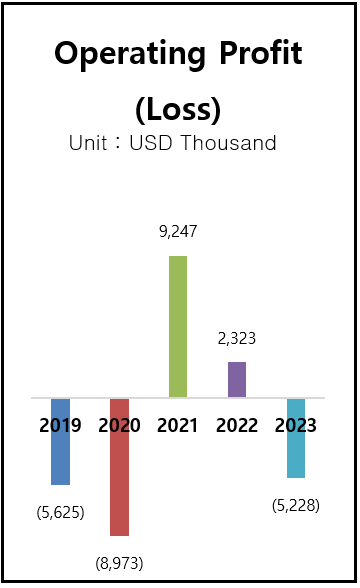
Summarized Consolidated Statement of Profit or Loss and Other Comprehensive Income

[Unit: USD Thousand]
Description 2020 2021 2022 2023 2024
Sales 309,367 412,096 473,879 376,213 367,977
Gross Profit 1,943 23,595 14,490 6,433 (4,044)
Operating Income (Loss) (8,973) 9,247 2,323 (5,228) (14,676)
Net Income (Loss) Before Income Taxes (7,825) 12,232 3,147 (1,140) (11,174)
Consolidated Net Income(Loss) (4,945) 9,564 2,896 (400) (8,294)
Net Income (Loss) Attributable to Equity Holders of Parent Company and Non-Controlling Interests (4,945) 9,564 2,896 (400) (8,294)
Comprehensive Income (Loss) (4,172) 9,470 2,857 (500) (8,396)
Comprehensive Income (Loss) Attributable to Equity Holders of Parent Company and Non-Controlling Interests (4,172) 9,470 2,857 (500) (8,396)
Net Income (Loss) per Share (full amount) (0.0009) 0.0017 0.0005 (0.0001) (0.0015)

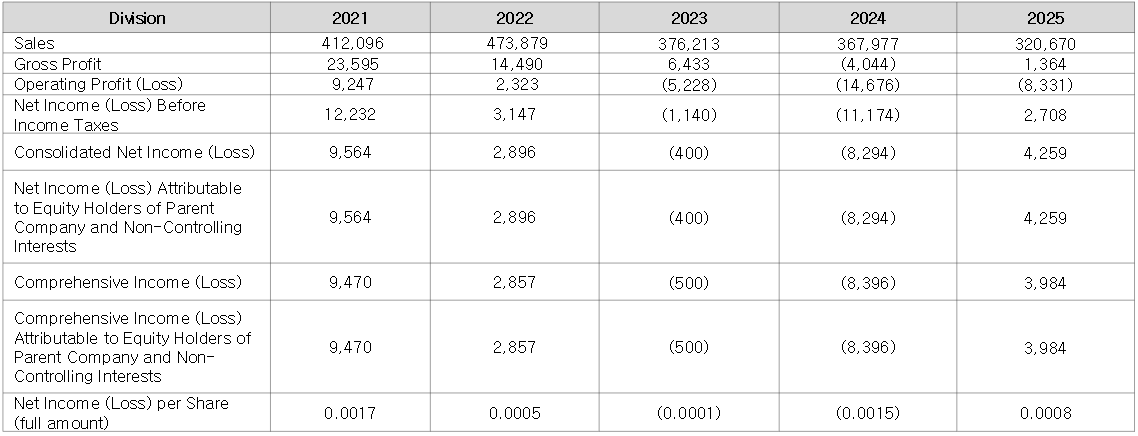
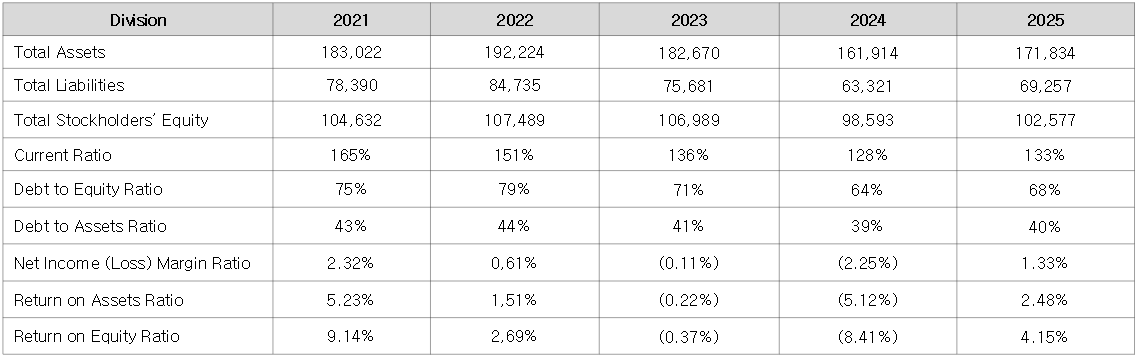
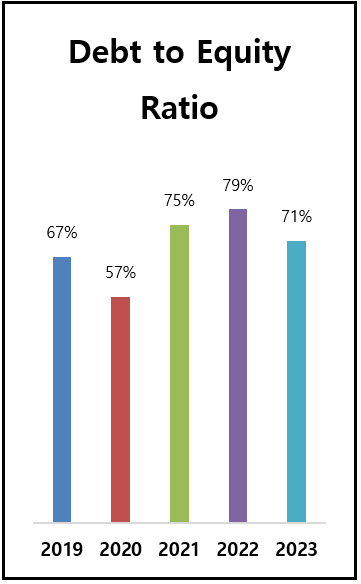
Summarized Consolidated Statement of Financial Position

[Unit: USD Thousand]
Description 2020 2021 2022 2023 2024
Total Assets 149,377 183,022 192,224 182,670 161,914
Total Liabilities 54,215 78,390 84,735 75,681 63,321
Total Stockholders’ Equity 95,162 104,632 107,489 106,989 98,593
Current Ratio 158% 165% 151% 136% 128%
Liabilities to Equity Ratio 60% 75% 79% 71% 64%
Debt to Assets Ratio 36% 43% 44% 41% 39%
Net Income (Loss) Margin Ratio (1.60%) 2.32% 0,61% (0,11%) (2.25%)
Return on Assets Ratio (3.31%) 5.23% 1,51% (0,22%) (5.12%)
Return on Equity Ratio (5.20%) 9.14% 2,69% (0,37%) (8.41%)